QR Code Report 2027: What 140,000 Real Scans Say About Dynamic QR Codes
By Diljit Ramachandran · LinkedIn · /about
Published · 9 min read
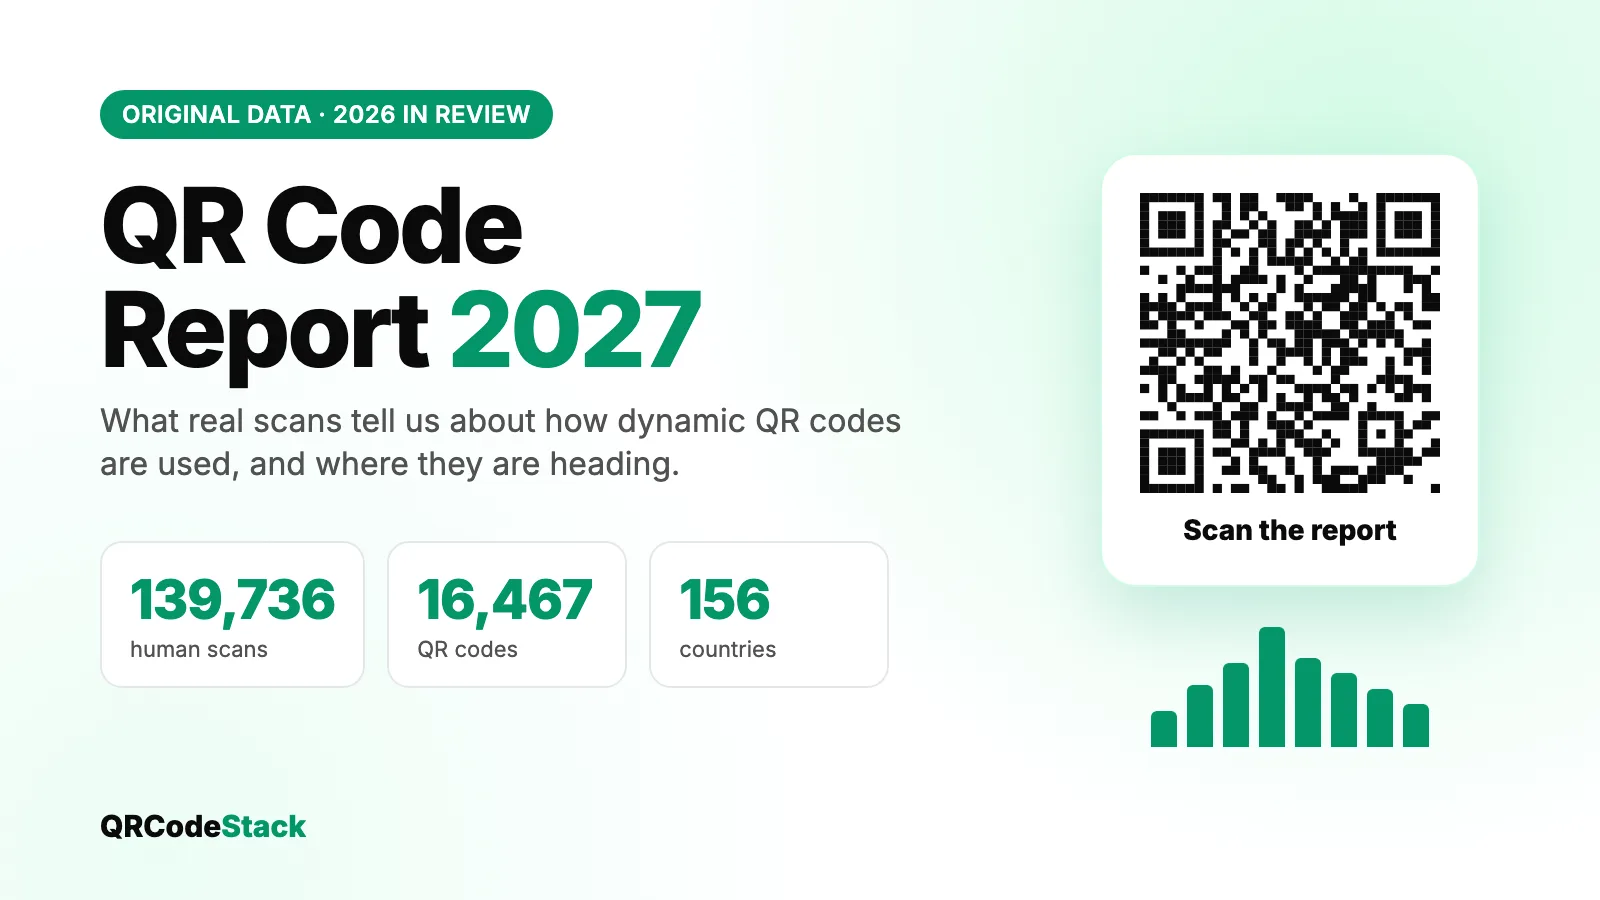
This report is built from what actually happened on QRCodeStack in 2026: 16,467 dynamic QR codes created by our customers and 139,736 scans by real people, from 156 countries. A dynamic QR code is a code that points to a short redirect link, so every scan passes through us and gets counted, and the destination can be changed after the code is printed. That makes these numbers a direct record of scanning behaviour rather than a survey of what people say they do.
Everything here is aggregated. No customer, code, destination or scanner is identified, and the figures describe QRCodeStack codes, not the whole QR market. The full method and its limits are at the end of the report.
Key findings
- Codes outlive their launch. 23% of scans happened more than 30 days after the code was created, and 7.3% more than three months later, even though most codes in the sample were only weeks old.
- Scans are extremely uneven. The top 1% of codes took 49% of all scans. The typical (median) scanned code was scanned twice, and 43% of codes created were never scanned by a person at all.
- Late morning on a weekday is peak time. 11:00 local time is the busiest hour, and weekend days see 27% fewer scans than weekdays.
- Android leads overall, but not everywhere. Android made 47% of scans and iOS 38%, yet iPhones made 63% of scans in Canada and only 15% in Indonesia.
- Most codes still look the same. 56% keep square dots, only 15% carry a logo and 16% use a frame.
- Not every "scan" is a person. From September to November, 8% of scan requests were repeats, link previews or bots, which raw scan counters report as real scans.
How long do QR codes keep getting scanned?
Longer than the campaign that created them. We measured the age of the code at the moment of every scan. Two thirds of scans happen in the first week, which is when a code is shared, printed and tested. After that the scans do not stop: 23% arrived more than a month after the code was made, and 7.3% arrived more than three months later.
Source: QRCodeStack platform data, 2026. Human scans only.
That long tail is understated. Most codes in this sample were created between August and October 2026, so few of them have had six months to collect scans yet. Posters, packaging, business cards and menus stay in circulation long after anyone remembers what link was put behind them. If that link breaks or the offer changes, a static code keeps sending people to the old place. This is the practical case for a dynamic QR code: the destination can be edited after printing without reprinting anything.
One more pattern from the first hours: 82.5% of codes that were ever scanned got their first scan within an hour of being created, and the typical first scan came about two minutes in. That is the owner checking that the code works before it goes to print, which is good practice and worth keeping.
Do most QR codes get scanned?
Many do not, and the ones that work take a large share. Of the 16,467 codes created in 2026, 9,316 (57%) received at least one scan from a person. Among those, the median code was scanned twice. The distribution is steep: the most-scanned 1% of codes, about 93 codes, received almost half of all scans, and the top 10% received nearly four in five.
Source: QRCodeStack platform data, 2026. Human scans only.
85 of the roughly 93 codes at the top were plain website links. A code that is never scanned is usually one that was created, tested and never deployed, or one placed where nobody had a reason to scan it. Placement, size and a clear reason to scan matter more than the code itself. Our QR code best practices guide covers the print side.
What time of day do people scan QR codes?
Scanning follows the working day. Measured in each scanner's local time, activity climbs from 07:00, peaks at 11:00 with 11.4% of the day's scans in that single hour, and eases through the afternoon. There is a smaller second lift around 18:00, when people are out at shops, restaurants and events. The quietest hour is 04:00.
Source: QRCodeStack platform data, 2026. Human scans only.
Across the week, Wednesday, Thursday and Friday are the busiest days and weekends are 27% quieter than an average weekday. If you publish a code on a schedule, such as a social post, an email or a screen, a weekday morning puts it in front of people when they are most likely to scan.
Source: QRCodeStack platform data, 2026. Human scans only.
Do more people scan with iPhone or Android?
Phones made 83% of scans, desktops 16% (mostly people opening a code from a screenshot or a PDF) and tablets under 1%. Across all scans Android led with 47% against 38% for iOS. The country split is far wider than that average suggests.
Source: QRCodeStack platform data, 2026. Human scans only.
In Canada and the United States roughly half or more of scanners hold an iPhone. In India and Indonesia more than eight in ten use Android, and the browser mix follows: Chrome handled 52% of scans, Safari 32% and Samsung Internet 5%. Test your landing page on a mid-range Android phone as well as an iPhone, especially for audiences in South and Southeast Asia. Heavy pages that load fine on a new iPhone are slow on the phones most of the world scans with.
Which countries scan QR codes the most?
Scans came from 156 countries and 5,120 cities. The United States and India together made almost half of them, followed by a group of Southeast Asian countries where scanning is part of everyday payments and messaging.
Source: QRCodeStack platform data, 2026. Human scans only.
Treat this as a picture of where our customers' codes were used, not a global ranking. A few busy codes from a single customer can move a country several places in this list.
What do people put behind a QR code?
Mostly a web link. Website and URL codes made up 86% of all codes created and 91% of all scans. The other types are small in number but tell a story when you look at how often they get used at all.
Source: QRCodeStack platform data, 2026. Codes created in 2026; human scans only.
Website codes were the most likely to be scanned at all. PDF and image codes were less likely to be deployed, but when they were, the typical one was scanned four times, against two or three for a website code, which fits menus, brochures and price lists that many people read. Plain text codes were almost never scanned: only 12% got a single scan. Text gives a scanner nothing to tap through to, and if you need to show information, a PDF code or a small web page works better.
How do people design their QR codes?
Conservatively. 56% of codes kept square dots, 66% kept black dots, and only 15% added a logo. A frame with a call to action, such as "Scan me", appeared on 16% of codes; the banner and focus frames were the most popular.
Source: QRCodeStack platform data, 2026. All codes created 1 Feb–13 Nov 2026.
Where people did customise, rounded shapes were the clear favourite, and one in three codes changed the dot colour. Customisation is safe as long as contrast stays high and the quiet margin around the code is kept. Advanced settings were rarely touched: under 1% of codes used an expiry date or scan limit, and password protection was close to zero. Most owners want a code that works and looks on-brand, not a code with rules.
How much QR code traffic is not human?
About one request in twelve. Since September 2026 we classify every request to a QR redirect. Of 142,755 requests between September and mid-November, 92.0% were people scanning. The rest were the same person reopening the link within a short window (4.8%), link previews generated when a QR link is pasted into a chat app or social post (2.6%), and bots or requests we could not classify (0.6%).
Source: QRCodeStack platform data, 2026. All requests to QR redirect links, classified.
A counter that reports every request as a scan overstates real reach by roughly 9%, and by far more on codes that get shared in chats. When you compare QR results across tools or campaigns, check whether the numbers are raw requests or human scans. Our QR scan tracking guide explains how each number is counted.
What to expect from QR codes in 2027
These are our predictions, each tied to something in the data above or to a published industry timeline.
- Dynamic becomes the default for anything printed. With 23% of scans arriving after the first month in a young sample, a fixed destination is a risk for any code that goes on paper or packaging. Expect "can I change it later?" to be the first question buyers ask.
- 2D barcodes reach the checkout. GS1 US's Sunrise 2027 goal is for retail point-of-sale scanners to read 2D barcodes such as QR codes by the end of 2027, so one code on a pack can serve both the till and the shopper. Our GS1 Digital Link guide explains the format.
- Product passports put QR codes on regulated goods. The EU's Ecodesign for Sustainable Products Regulation introduces a digital product passport, reached through a data carrier such as a QR code, as product rules are adopted category by category.
- Clean analytics separates serious tools from counters. With about 8% of requests not being people, and far more on links shared in chats, platforms will be judged on whether they filter repeats, previews and bots before reporting a number.
- Codes are created where the design is made. Expect QR creation to move further into design apps, print workflows and AI assistants, so the code is added at the moment the artwork is finished instead of in a separate tool afterwards.
- Android-first testing for global audiences. With iOS under 20% of scans in India and Indonesia, landing pages that are tested only on iPhones will underperform across the fastest-growing scanning markets.
Methodology and limits
- Sample: every QR code created on QRCodeStack between 1 February and 13 November 2026 (16,467 codes), and every scan of them recorded through our redirect service in that period.
- Human scans only: each request to a QR redirect is classified as a person, a repeat by the same visitor, a link preview, an automated client, or uncertain. Charts use human scans only. Classification was switched on in August 2026, so most scan-level figures (device, country, time, type) reflect August to mid-November 2026; requests from earlier months that could not be classified are excluded.
- Local time: the hour and day charts use the time zone reported by the scanner's browser, so 11:00 means 11:00 where the person was standing.
- Location and device: country and city come from the scanner's IP address; device and operating system from the browser's user agent.
- Privacy: all figures are aggregates. No customer, code, destination, IP address or individual scanner is published or can be derived from this report.
- Scope: this describes QRCodeStack customers, who skew toward small businesses and educators. It is not a measurement of the whole QR market, and static QR codes cannot be measured by anyone.
You are welcome to cite this report; please link to this page as the source. Our earlier mid-year sample is in the 2026 scan report.
See these numbers for your own codes
Every dynamic code on QRCodeStack reports human scans by time, city and device, and you can change where it points after printing.
Start free trial7-day free trial, no credit card · 5 dynamic codes · Paid plans from $9/month (pricing)